
The journey building a "Cursor for Excel"
Trials, tribulations, successes and lessons building a horizontal platform

TLDR: last year I set out to build “Cursor for Excel”, an AI agent specialized in financial modeling. The process was thrilling, edifying, but at the same time exasperating given the evolving behavior and capabilities of the underlying LLMs, which constantly sent me back to the drawing board to attempt new things. This is a short account of the different things I tried, and the stable solution I landed on. My hope is to convey the experience and intuition for what it’s like to build an “AI-powered/native” product.
1. Motivation
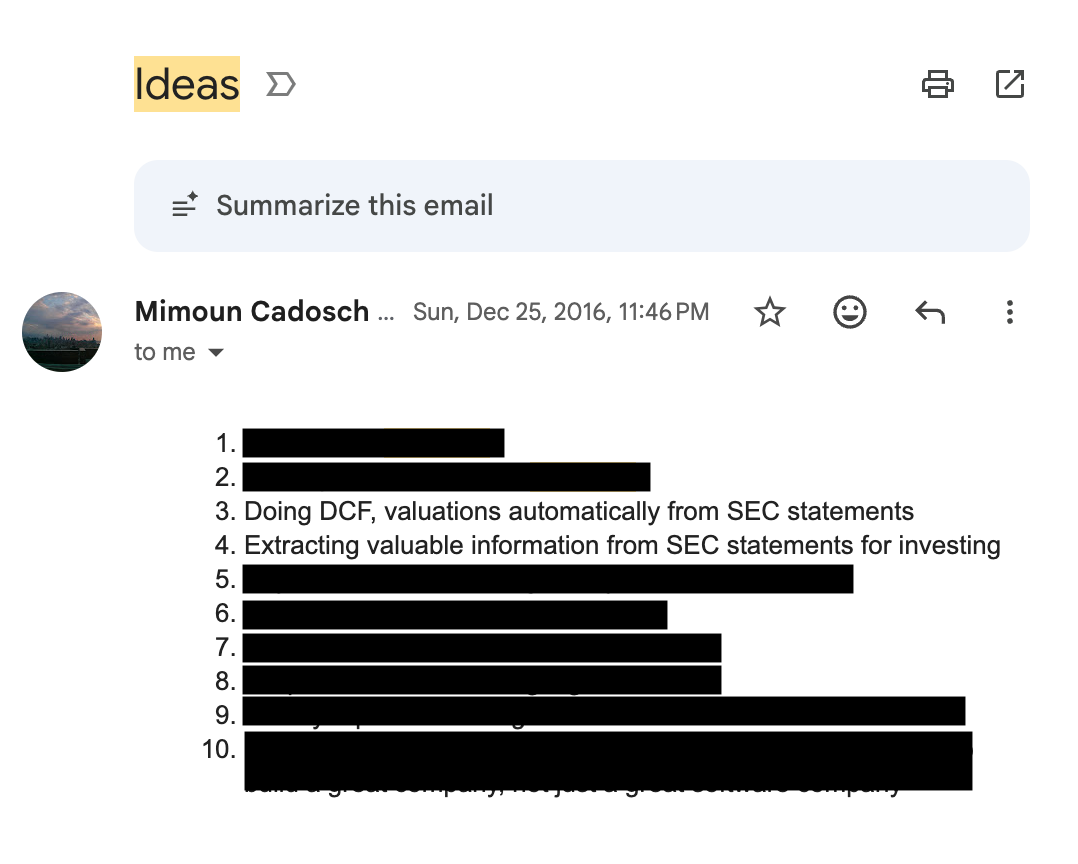
Every time I have an idea for a project/business/research project, I send myself an email with subject line “Idea”, so I don’t forget and can revisit later. December 2016, I must’ve felt very inspired, as I sent myself a long list ideas. Among them, an AI that can build financial models for you. The motivation came from my three internships in investment banking (high school and during Penn), inspired by the long hours copying and checking formulas late into the night. I had some free time after leaving Matterworks. Given the progress in AI, my idea was finally possible. So I decided to dive head-down into building it.
The thesis was very clear: 1B people use Excel / spreadsheets, there is a lot of knowledge of financial models encoded in the LLMs. Naturally, if you could build an agent that “natively” translated user context and requirements into financial models, you would build a very valuable product.
Long story short… in October 2025, I decided to kill this project. Simply, there was too much competition, especially from well-resourced and nimble AI Labs, and you can’t build a sustainable business on an undifferentiated product. A short post-mortem can be found here.
Here, I want to walk you through the technical journey of what it was like to build a “Cursor for Excel”. Most notably through this process, and different from anything else I’ve built in my life: the LLMs, which are fundamental tool underlying the agent, was always evolving, which required me to constantly reconsider my techniques, approaches, and methods. The LLMs improved so quickly through 2025, that I found myself trying and changing approaches constantly. It can feel very disorienting, as you are never really “done” and there’s always something you want to try. I guess that’s why the “AI Engineer” title really makes sense: you are never really building something final, but it needs to be stable enough to work at any given point. I figure this is the new reality of building applications on top of LLMs. The ground is constantly shifting from under you, and as an engineer building AI applications you are forced to constantly stress-test your assumptions, experiment, and re-write big chunks of your codebase.
In any event, I hope that sharing this journey will guide, inspire, and hopefully not dissuade too many of you from building horizontal AI applications like I tried.
2. Background
2.1. Why Excel is hard for LLMs
Why can’t LLMs produce correct, consistent, properly formatted spreadsheet output, for real (non-toy) cases? This question is difficult to answer absent deep, inside knowledge into how the frontier models are trained. But, I could at least postulate a few reasons that make it hard for LLMs to generate spreadsheet content:
The spatial structure of financial models is non-sequential. Intuitively, two cells can be adjacent that are not related, and two cells can be far apart that are closely related. This puts a lot of strain on the LLM attention mechanism to keep track of long-range dependencies, especially in cases of real-world spreadsheets that can easily exceed the context window of even GPT-4 or Claude 3.5.
The requirement for Structured Output takes a hit on performance. The need to produce Cells that follow a specific schema requires using LLMs in Structured Output mode, and it’s been demonstrated that it deteriorates reasoning performance.
Minimal / limited post-training on spreadsheet data. The main reason, I suspect, is the simplest one: LLMs (at least circa mid-2025), simply hadn’t been well trained to generate spreadsheet output! My first attempts showed the LLMs had some concept of what an income statement or balance sheet was, but when asked to produce one, they were overly simplistic and often wrong.
2.2. Representing spreadsheet data
First, some background. Spreadsheets are a sequence of cells, each cell essentially containing:
Location: (e.g. A1)
Formula (e.g. =B1+C1)
Calculated value (e.g. 3)
Styling (e.g. blue background, red font, bold italic)
Format (e.g. 0.00, %, $xx.xx, etc.)
These cells can be represented as XML, JSON, YAML, or using any other structured language. Yes, there are nuances around token consumption and LLM performance on different languages, but these can all essentially be used to describe a spreadsheet. Markdown tables, CSV, or TSV were ruled out, even though they are often used to represent tabular data, because they don’t make it easy to store the different metadata (e.g. format, underlying formula, etc.)
2.3. Background work
When I first tackled this problem, what struck me most as odd was… the lack of published literature on the subject. After searching “LLM + spreadsheets”, “LLM + Excel”, and a few other key queries, the most relevant paper I could find was SpreadsheetLLM, which includes some nifty tricks on how to concisely encode spreadsheets for LLM processing, but was far from the system-wide guidance you need to actually pull it off.
3. Architecture
3.1. Agent Loop
From the beginning, I adopted an agentic architecture. Meaning, users would interact with an agent in a main loop, that would in turn make calls to different tools for parsing documents (financials PDFs, excel spreadsheets, etc.), retrieving data (e.g. SEC Edgar), and most importantly, interacting with the spreadsheet. Here, my focus is on the agent-spreadsheet interaction. In other words, what are the best tools for an agent to produce correct, consistent Excel content, quickly, with proper formatting and following Wall St conventions?
3.2. Implementation
I could write an entire post on actual implementation. In the interest of keeping this post focused (and short), I will just say that I hosted this project on Railway, using redis for asynchronous agent execution loops, simple postgres DB, MinIO for object storage, Docling for document parsing, and mostly Gemini/Claude as the underlying LLMs.
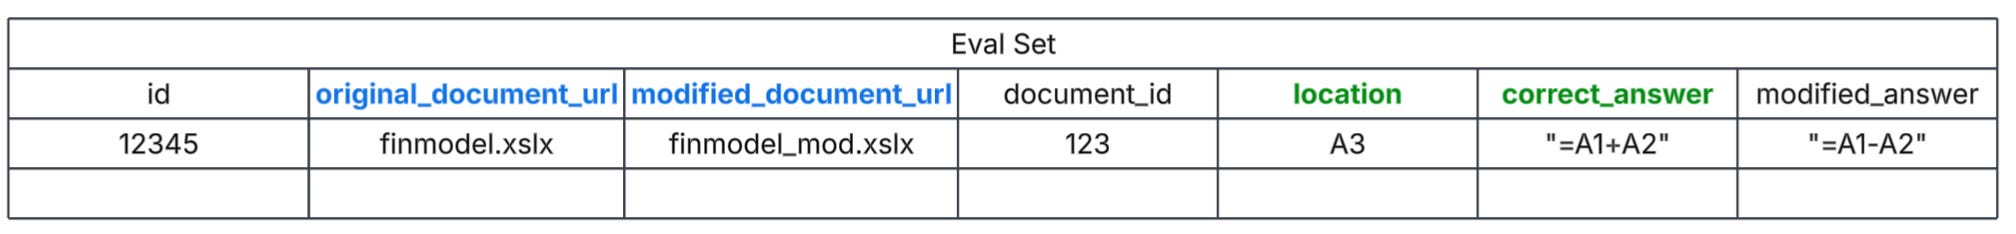
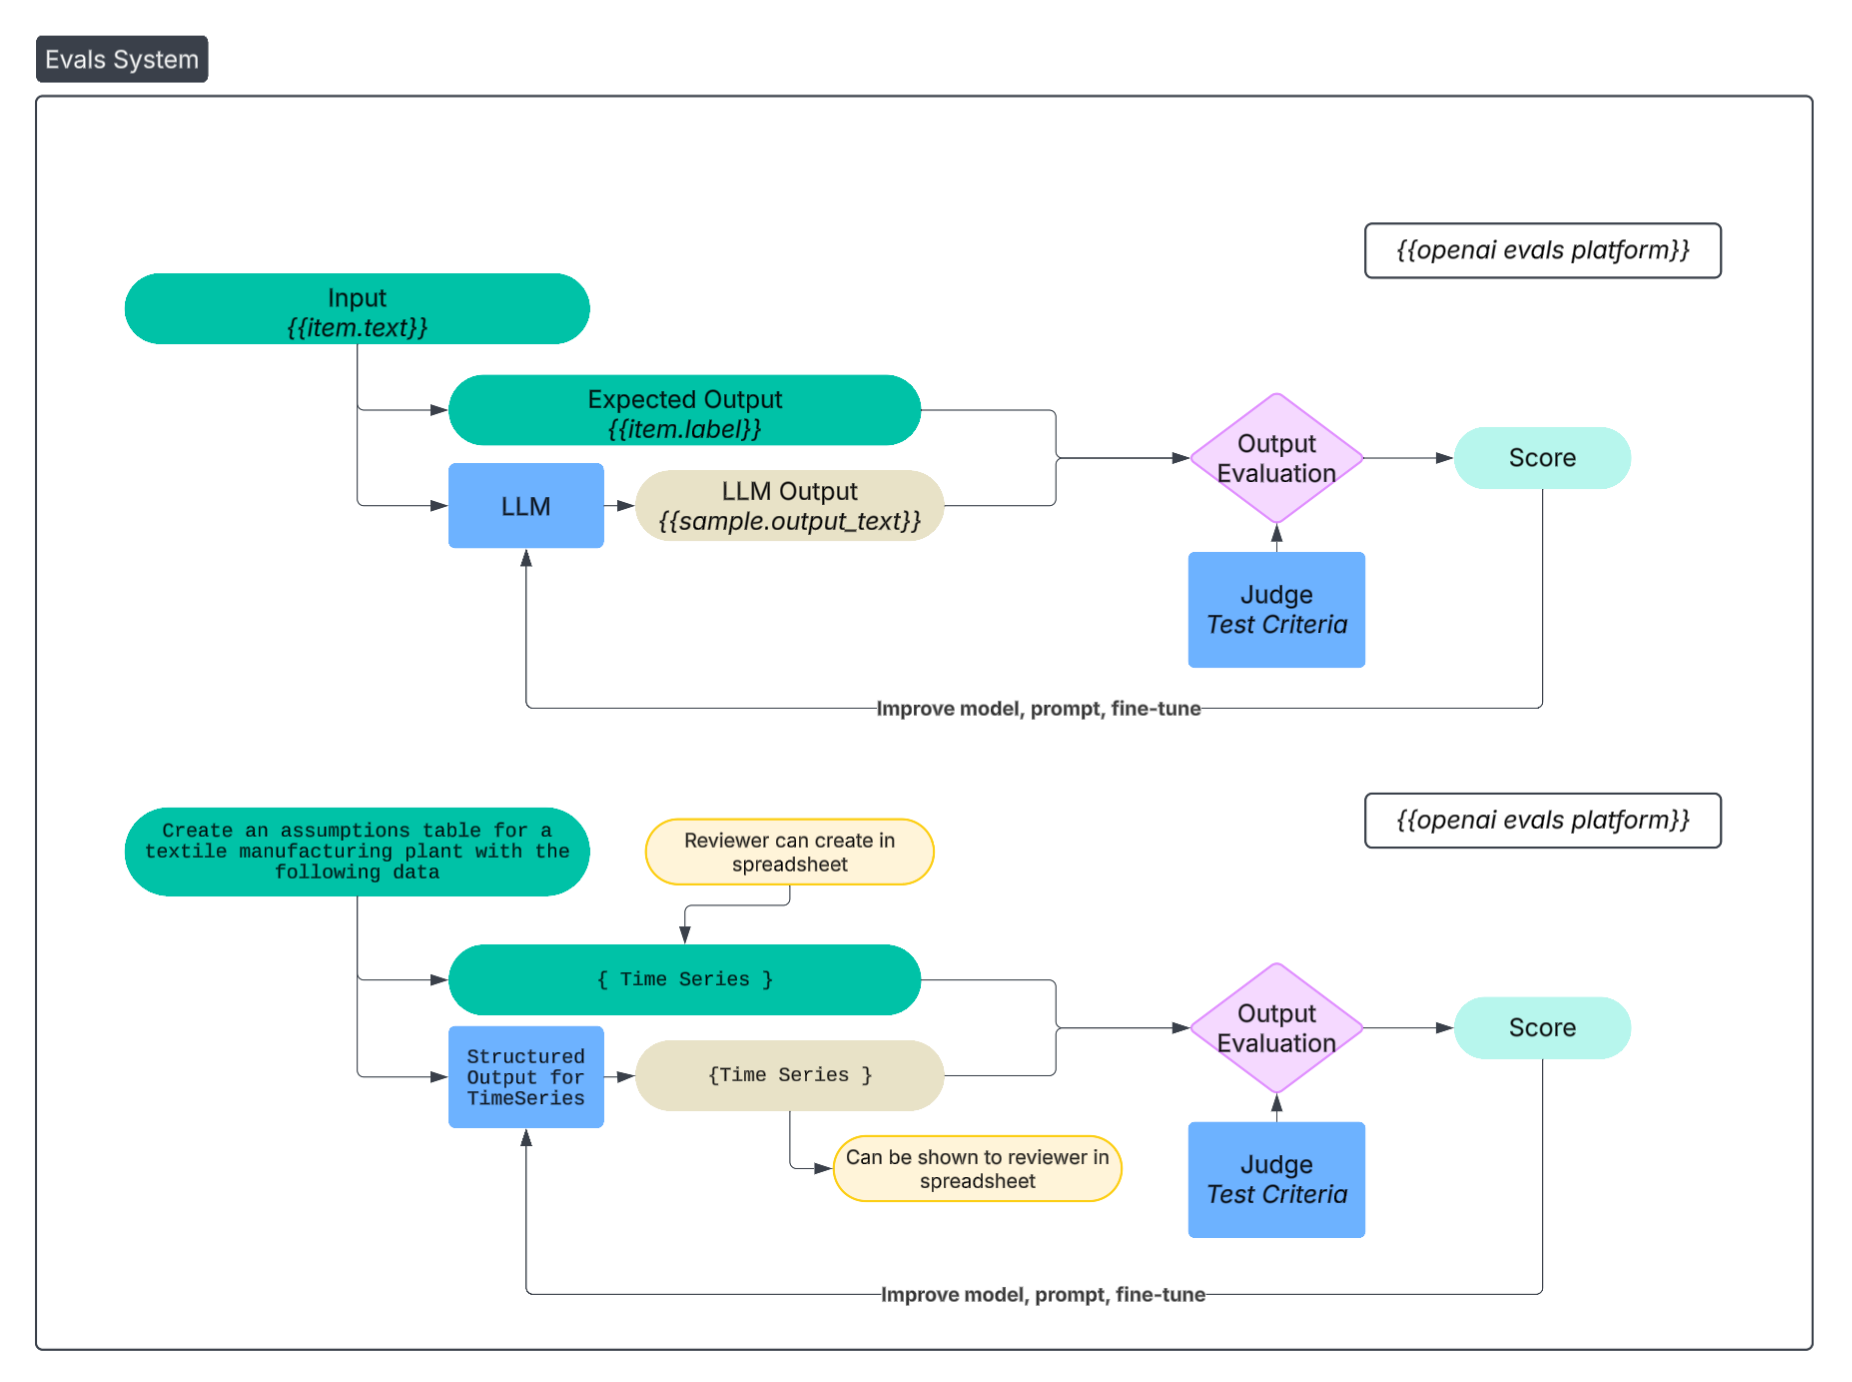
3.3. Evals & Testing
There’s some debate about the extent to which evals are actually used. I would like to tell you that from the onset I created an extensive, representative eval set I diligently run against every iteration of the system. And that eventually became true. But, at the beginning, my eval set consisted of nothing more than a few, simple examples I could eyeball verify:
“Create a 5-year DCF for TSLA, assuming revenue growth 10%, 20% gross margins, 10% terminal growth rates, projecting financials through 2024.”
Eventually, my system for evaluation and eval set became more involved. I downloaded several completed financial models I found on the internet. I would either delete/modify specific parts of the financial model, and create prompts asking the agent to add/fix those.
4. First attempts (and why they failed)
4.1. JSON cell representation as Structured Output
My first approach, naturally, was the obvious one, i.e. have the LLM generate JSON representing the cells in the spreadsheet. The JSON needs to follow a specific structure (e.g. include location, formula, etc.), so I used structured output to obtain the desired one. OpenAI and Gemini have nice APIs for it, Anthropic less so. Circa 2023, when I started testing LLMs for this exact purpose, the output was abysmal. My “hello world” simple test I would run was a simple DCF model of “Mimoun’s Bakery” with some simple assumptions around revenue, margins, time horizon, and so on.
Results
Suffice to say, even though the LLMs produced syntactically correct JSON, the semantics were a disaster in that the actual formulas and values were completely wrong. For example, cells would be referenced that don’t exist, formulas (SUM, IRR, etc.) were incorrect, and formatting did not follow convention. So, I decided to put this approach on pause until the underlying LLMs got better at producing such output.
4.2. Domain-specific artifacts
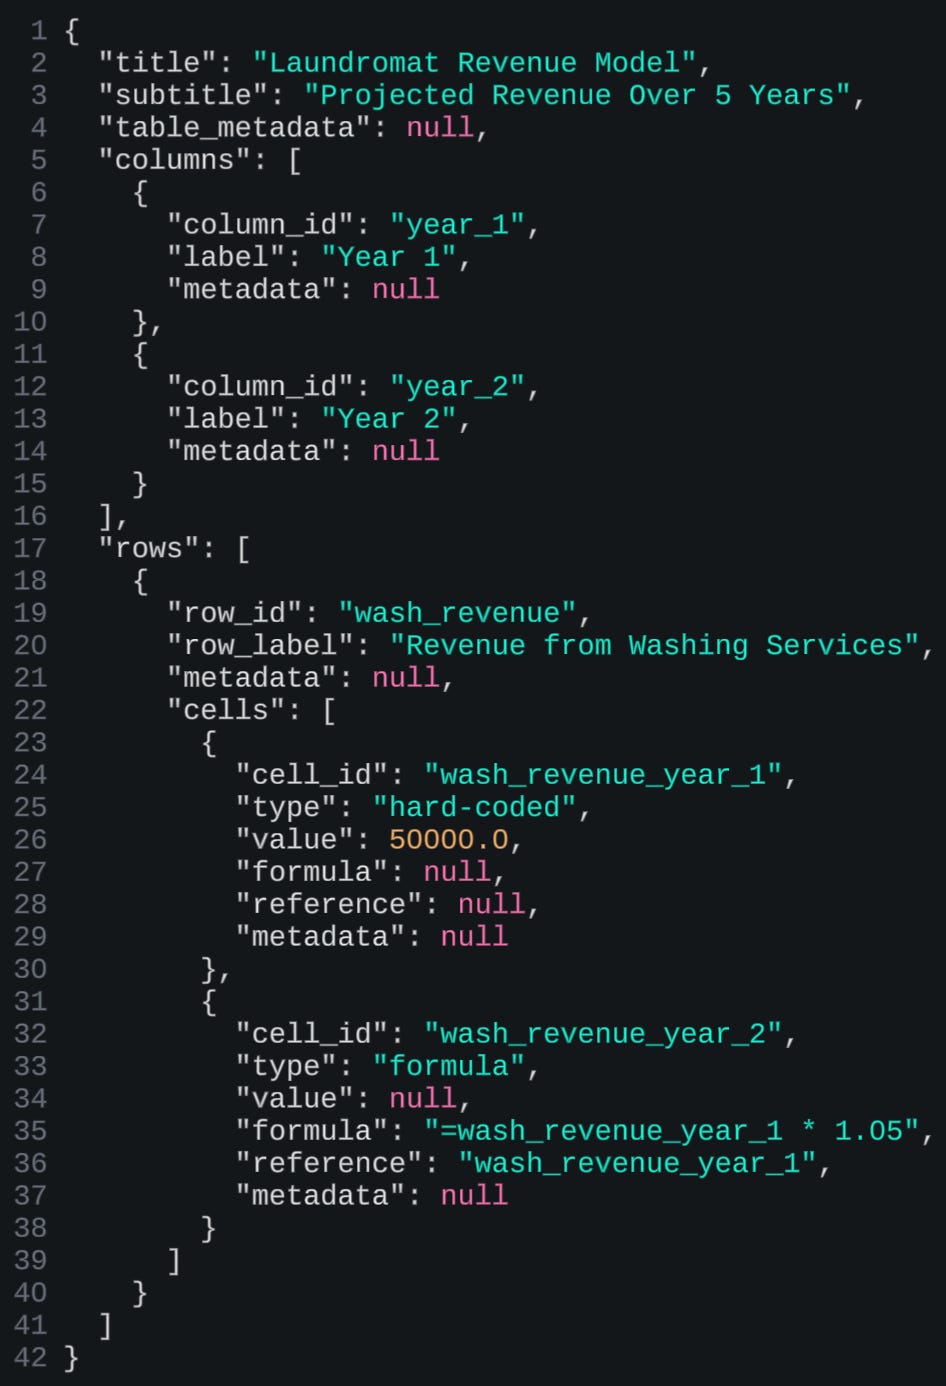
My second approach (and 3rd, as you will see), where a bit more forceful, in that I gave the LLM fewer degrees of freedom. This approach relied on the assumption that all financial models rely on a narrow and discrete set of “artifact” types: assumption tables, time series, sensitivity tables, etc. (see: “Anatomy Of A Table”). Artifacts would be generated via structured output, and the LLM would instantiate them given the information that it had.
Results
This worked well enough, except for one three main limitations. First, in practice, there is a lot of variability around so-called artifacts. An assumptions table can look one of many different ways, a time series as well. Small details, e.g. where you place a date, how you space columns, etc. — really matter. Users are very nit-picky about their preferences. For real adoption, users would want more “expressivity” out of the finance agent. Other limitation of this approach is: what happens when a user edits/deletes part of an artifact, breaking the so-called schema of said artifact? It’s really hard to decide, as a system designer, how to approach that. Finally, even though in principle you are restricting the degrees of freedom on an artifact, there was still, in practice, too much stochastic variability in the output, from one session to another. This kind of beat the whole raison-d’être for this approach.
4.3. Domain-specific language
This 3rd approach was born out of desperation: even though the first and second approaches could work, in theory, and I could see a time where the LLMs would finally produce correct and consistent output, that time still seemed very far away, and I wanted to get a working product now. So I came up with the following idea: what if a financial model could be expressed as a Python script? If so, this approach would present a few benefits: (1) LLMs are very good at writing Python, (2) you could express verifications as code (e.g. gross_profit = revenue - cogs), and (3) your financial models would be incredibly concise, (4) trivial to update and maintain. This, however, required the creation of a domain-specific language (in the form of a Python library), that would translate Python to the requisite Excel, and then ensuring the LLM would properly use that library.
Results
This approach was really hard to get to work, for two reasons: you had to maintain, develop the Python-to-Excel library, which was a lot of work, and constantly required debugging, extending. I spent minimum effort on it, and vibe-coded most of it, which meant it was sub-par. The second reason is that getting the LLM to use the library correctly was also challenging, as the LLM would often hallucinate methods, attributes, and otherwise mis-use the library. I created ample, thorough, and exhaustive documentation for the LLM on how to use the library, but without any fine-tuning, the LLM would constantly make mistakes. As part of the agentic loop, if the agent encountered a run-time error when running the script, it would modify the script (using Morph, which I enjoyed using). But oftentimes the agent would get stuck in an infinite loop where it would correct mistakes with other mistakes and never get to an answer.
4.4: Domain-specific artifacts with fewer restrictions
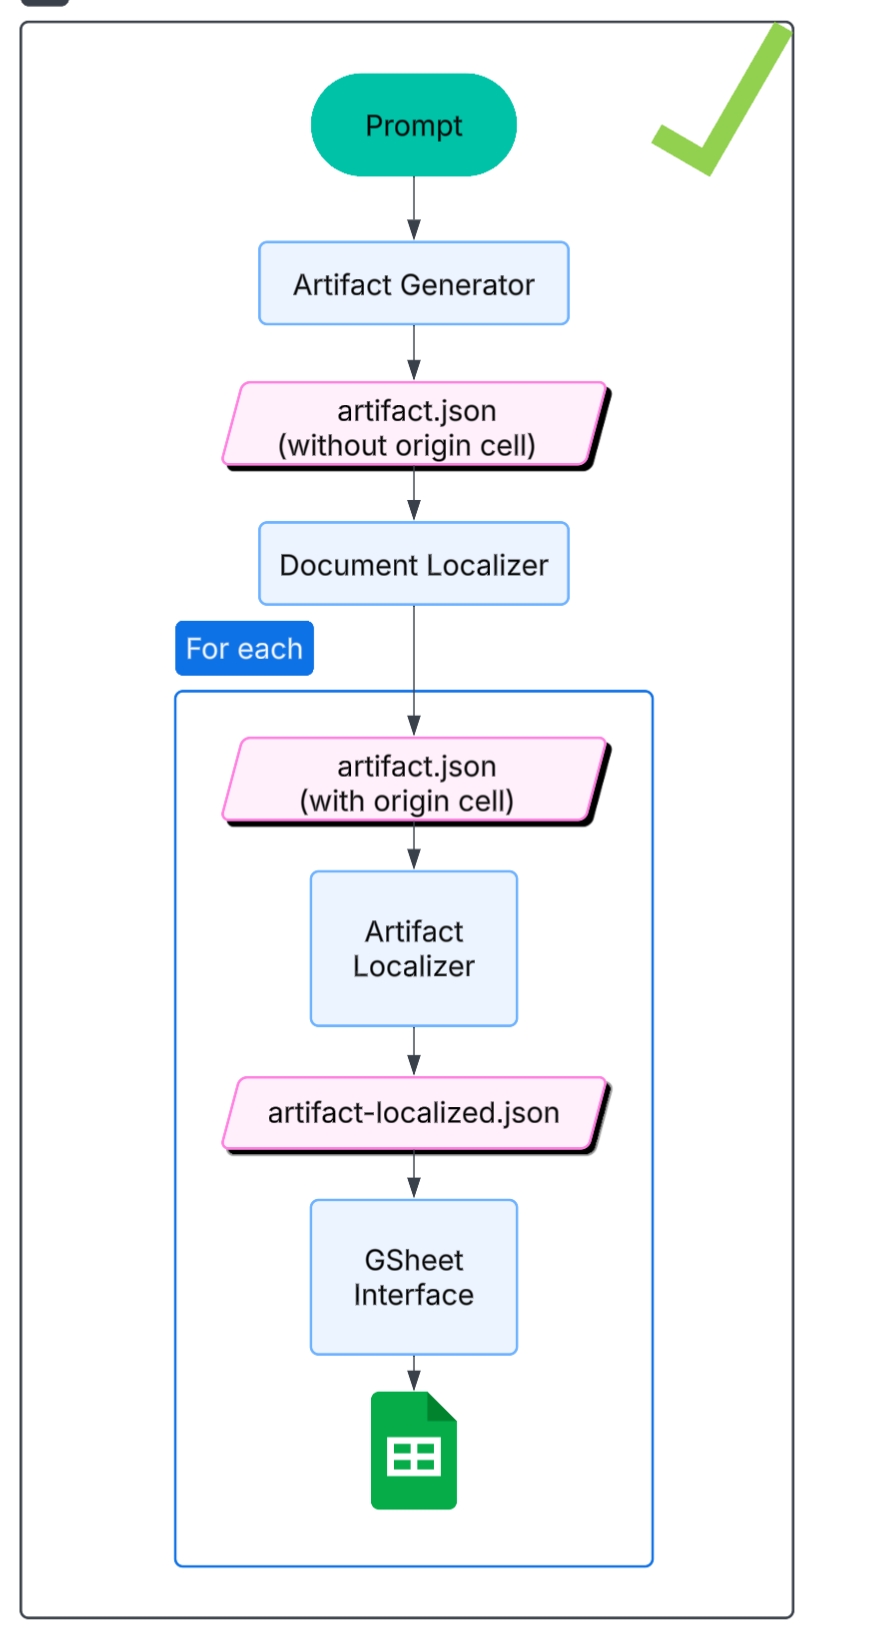
I tried the Artifact approach once more, this time with a minor difference. Artifacts would be specified as lists of cells, with a given location. The agent loop looked very similar to the first approach, except I gave the LLM much more flexibility in terms of creating an artifact. Artifacts no longer needed to abide by a structured output for an assumptions table, sensitivity table, etc. Instead, they could be any arbitrary sequence of cells. I also refined the tool calls for the agent, into the following:
Create Artifact: e.g. assumptions table, income statement, debt schedule)
Validate Artifact: ensuring it is syntactically correct (the structured output includes a location, a value and/or formula, style)
Register Artifact: saving the artifact metadata to a DB that keeps track of what’s in the spreadsheet
Add Artifact: actually placing that artifact in the spreadsheet (via Google Sheets API or however you’re interacting with Excel)
Validate Output: ensure there are no cross-artifact errors: no circularities, no broken references
Edit Artifact: make any changes to fix any cross- or within- artifact errors.
Run Checks: run deterministic checks to verify the correctness and integrity of the financial model (e.g. do assets = debt + equity?). The checks would be generated by the agent, given its knowledge of financial models, but the user would be able to configure specific checks as well.
There is a whole lot of detail that goes into engineering the right context in every tool, such that the LLM that’s doing the work has the right information (and not too much, polluting information) to perform its job. For example, the Edit Artifact tool call would require both the “Artifact Registry” (what’s in the spreadsheet and where), the errors, and the documentation listing most common errors and how to address them. Even something as fundamental as ensuring that “assets = equity + liabilities” is very difficult, even for a human analyst, and the steps of what to look for can vary significantly based on the type of company and level of detail of the financial statements.
Results
Suffice to say, this approach really started working, not only with my toy example of a DCF for “Mimoun’s bakery”, but also with more involved examples. When I started demo’ing the application at this point, is when I started getting “wow”s and “that’s so cool”, “can I get access?” and “will it work for my model?”.
Accelerated time lapse of what the web app looked like at this point
5. The Final Approach
This is the last approach I tried, that worked best. Not surprisingly, it leveraged all the lessons from approaches 1…4, and made the best out of all the trade-offs present between the different system design choices. Surprisingly (perhaps it shouldn’t be?), it was also the simplest, and most elegant approach. Is that surprising? Not really. Oftentimes the simplest approach is also the most difficult, as it can only be attained after trying and abandoning many other attempts, and relentlessly killing what doesn’t work, while finding and defining the right primitives and abstractions that do. There is a satisfaction with being so deeply embedded in a problem, in that ideas and solutions start coming to you in the middle of the night, and your brain starts building the right levels of abstraction to design the simplest, most elegant solution.
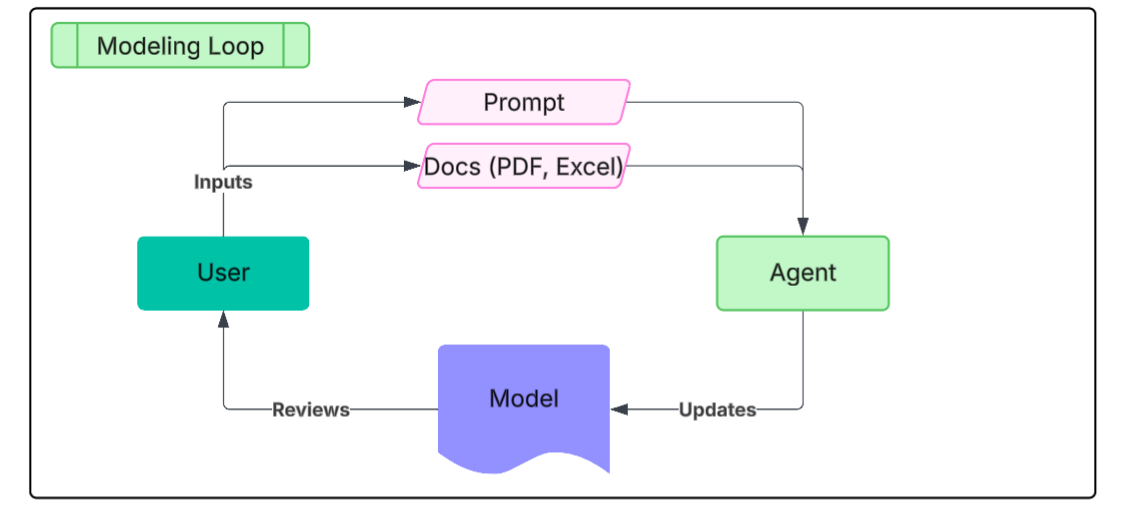
So, what was this approach? The agent loop was endowed with the following tools:
Index document: Create an index of all tables in the spreadsheet. This tool analyzes the Excel document structure and creates a comprehensive index of all tables, including their positions, descriptions, and key sections.
Search document: Given a query, return all the relevant parts of the spreadsheet (e.g. in: “income statement”, out: A1:E100, meaning the range-boundary of said income statement.)
Read document: Given a range (e.g. A1, A1:A10, A1:B10), return the formulas, values, and styling
Edit document: given a range, edit to make (“edit”, “add”, “delete”), and include the relevant formula and values.
Format cells: given a range of cells, format them according to some styling (e.g. bold/italic, font size, borders, colors, etc.)
If you think about it, these tools are basically all you need in the agent loop. At the beginning, the agent indexes the spreadsheet, meaning it creates a table of contents of what’s in the document (location) and some metadata. Then, following user prompts (create a DCF of “Mimoun’s Bakery”), it runs the following tool calls in a loop:
(1) Use the index to find any requisite dependencies (e.g. cash flow statement requires information from both income statement and balance sheet),
(2) Read the document to find the requisite references to any values and/or dependencies,
(3) Edit the document to create the new “artifact”,
(4) Format the document according to finance conventions (e.g. assumptions in blue)
Results
These primitives work really well as the right level of “specialization of labor” between different tool calls. They allowed for context engineering that presented the LLM with what it needed, but not more. It is expressive enough to allow any sort of artifact, while giving the LLM some responsibility for keeping track of what’s in the system and paying attention to dependencies in values and references.
6. Concluding thoughts
This is my longest post to date. Far from exhaustive, and light on technical implementation details, you can find the Github repo here. Last I saw, almost all competitive products (e.g. Google Sheets AI, Microsoft Copilot, Shortcut, Claude for Finance, OpenAI Finance, Endex, list goes on) have landed on a similar architecture and choice of tools. Obviously, there is so much to improve, but given the state of frontier models (Claude 4.5, GPT 5, Gemini 3), this system design seems (in my experience) to work best. I hope you enjoyed.